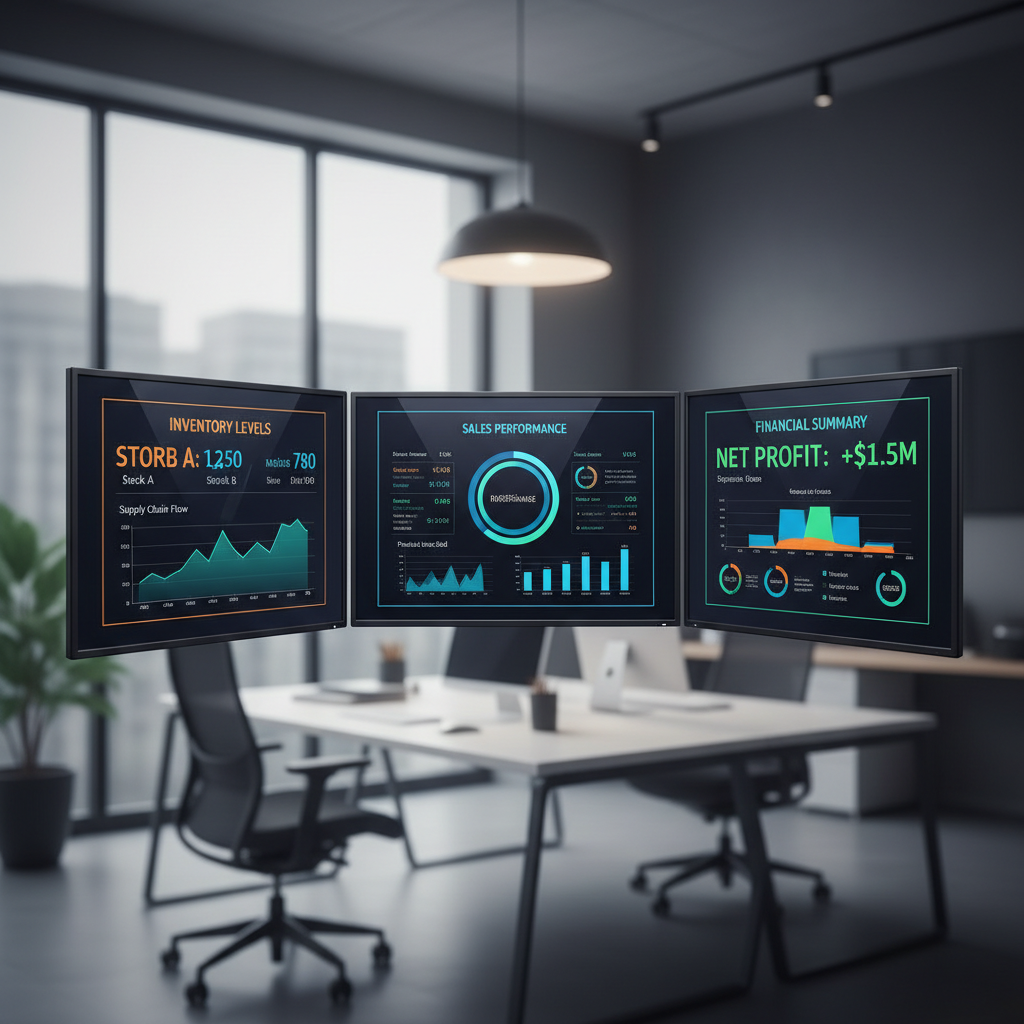
Small businesses build actionable dashboards by leveraging ERP reporting and analytics to track critical KPIs like cash flow, inventory turnover, and margin leakage. This data-driven approach provides real-time visibility into business health; it enables leaders to make informed decisions that improve operational efficiency and long-term growth.
Most small business owners feel buried under mountains of data while simultaneously starving for the specific insights needed to make confident decisions. While your ERP system captures every transaction, warehouse movement, and procurement order, this raw information often remains siloed or inaccessible in a format that supports strategic growth. Bridging the gap between mere data storage and true business intelligence is essential for maintaining a competitive edge in manufacturing and distribution. Without reliable reporting, your organization risks reacting to yesterday’s problems rather than anticipating tomorrow’s market shifts. In this guide, we will explore the practical steps for establishing data hygiene, identifying high-impact KPIs, and selecting the right dashboard tools to turn your ERP into a predictive engine. You will learn how to transition from static reports to dynamic, actionable analytics that empower your team to act with precision.
The Gap Between Data and Decisions in Modern ERP Systems
Small business owners often find themselves in a paradoxical situation: they have more data than ever before, yet they feel less informed. When modernizing operations, the initial goal is usually to capture every transaction, shipment, and customer interaction. However, without a clear strategy for ERP reporting and analytics, these businesses end up with thousands of raw database entries that provide no clear path forward. This gap between having data and making a decision is where many digital initiatives stall.
Across Utah and the rest of the US, organizations struggle with a specific type of information overload. They generate dozens of automated reports every Monday morning, but these documents often sit unread because they lack context or actionable insight. In this environment, it is critical to differentiate between static reports and dynamic analytics. Static reports are essentially a rearview mirror; they document the past, showing what was sold or spent last month. While these are necessary for accounting and compliance, they do little to help a business scale or pivot in real time.
Dynamic analytics, conversely, acts as the bridge to strategic leadership. By connecting disparate data points from sales, inventory, and finance, analytics allow leaders to identify trends and predict outcomes. Navigating the digital transformation lifecycle successfully requires moving beyond simple lists of numbers and toward a system where data informs behavior. The goal is not just to see where the business has been, but to understand exactly where it is going and which specific levers to pull to change the trajectory.
Step 1: Establishing Data Hygiene and Reliability
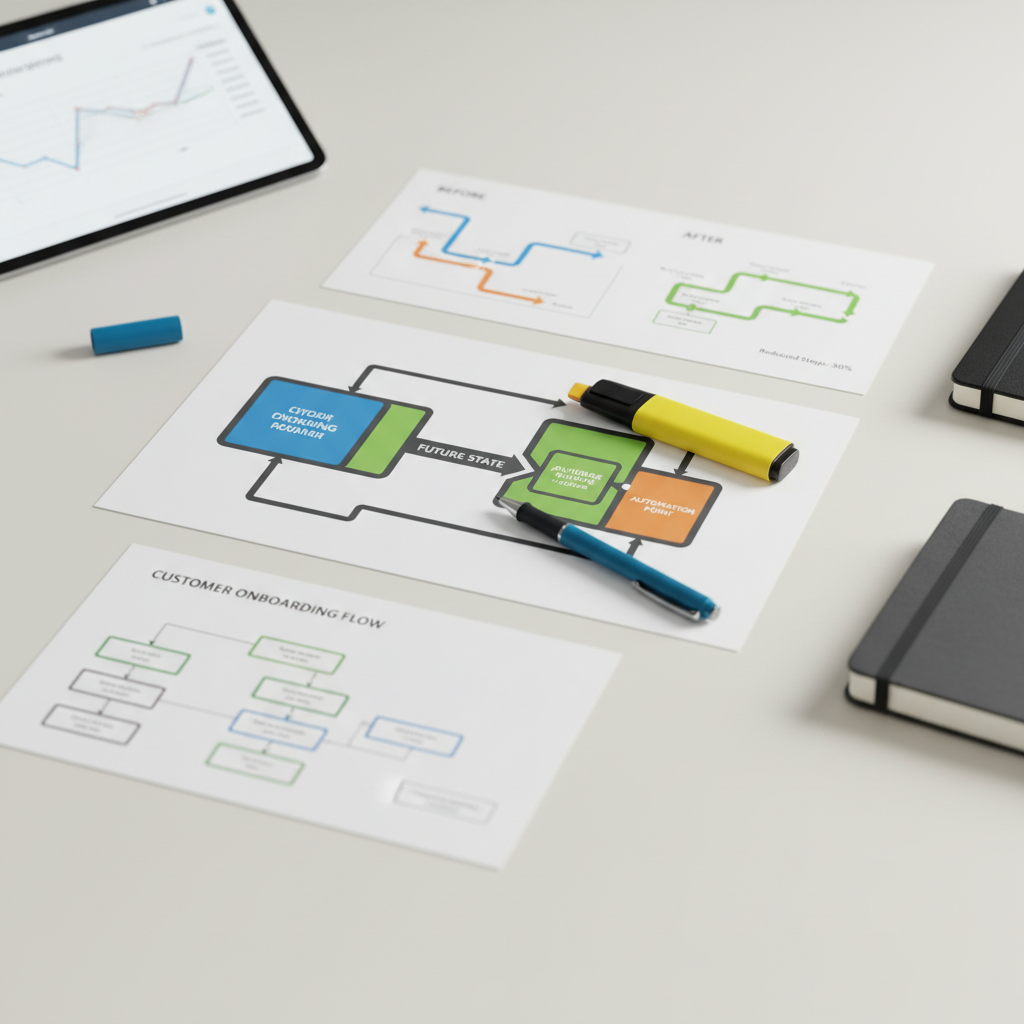
Before you can visualize success, you must trust the numbers appearing on your screen. The most sophisticated ERP reporting and analytics engine is ultimately limited by the quality of the data it processes. In the industry, this is known as the "Garbage In, Garbage Out" principle. If your warehouse staff records inventory receipts inconsistently or sales reps leave critical fields blank, your executive dashboard will reflect a distorted reality.
To build a reliable foundation, start by auditing your primary data entry workflows. In inventory management, ensure every item receipt matches a purchase order with a specific SKU format. In accounting, verify that expenses are categorized at the moment of entry rather than being dumped into a "miscellaneous" account for later sorting. We recommend implementing strict validation rules within your software. By enforcing mandatory fields, standardized date formats, and predefined drop-down menus, you eliminate the variance that breaks automated reports.
Clean workflows are the prerequisite for clean dashboards. When modernizing operations, focus first on these manual touchpoints. Standardizing how data enters the system ensures that the digital transformation lifecycle results in a single version of the truth, allowing leadership to make decisions based on facts rather than assumptions. If your current data feels untrustworthy, contact our team to evaluate your entry processes.
Step 2: Identifying the KPIs That Actually Move the Needle

Once the foundation of clean data is set, the next challenge is curation. Many businesses fall into the trap of tracking dozens of metrics simply because their software makes it easy to do so. However, an effective executive dashboard should focus exclusively on the "Vital Few." When clients ask what KPIs their dashboard should track, the most effective approach is to categorize metrics by their impact on the bottom line.
Core Performance Pillars
Category | Vital KPI | Why It Matters |
|---|---|---|
Financials | Gross Profit Margin | Direct indicator of pricing health and cost control. |
Financials | AR Aging | Monitors how quickly revenue converts to usable cash. |
Operations | Inventory Turnover | Measures how efficiently capital is deployed in the warehouse. |
Operations | Order Cycle Time | Tracks the speed and efficiency of the fulfillment process. |
Sales | Customer Acquisition Cost | Evaluates the return on investment for marketing spend. |
Sales | Lead-to-Close Ratio | Identifies the effectiveness of the sales pipeline and team. |
Every metric chosen for your ERP reporting and analytics must follow the SMART framework; being specific, measurable, achievable, relevant, and time-bound. However, we add a critical behavioral layer to this evaluation. If a KPI does not prompt a specific management action when the numbers change, it does not belong on your primary dashboard.
For example, if your AR Aging report shows a spike in invoices over 60 days, the behavioral response is to pause new shipments to those accounts or escalate collections. If a metric like "Total Website Visits" fluctuates but doesn't change how you run your daily operations, it is a vanity metric that creates noise. This disciplined selection process ensures that modernizing operations leads to actual improvements in performance. By focusing on the metrics that drive behavior, the digital transformation lifecycle provides a clear roadmap for growth. If you are struggling to narrow down your focus, contact our team to help define the metrics that matter most for your specific industry.
ERP Reporting for Manufacturing and Distribution: A Focused Approach
For manufacturing and distribution firms, generic financial metrics are insufficient for daily management. These sectors require specialized ERP reporting and analytics to align the shop floor or warehouse with the executive suite. A manufacturing KPI dashboard should prioritize Planned vs. Actual Production. By tracking this in real time, supervisors can identify specific work centers that are falling behind; this allows for immediate adjustments to labor or machine maintenance before a shipping deadline is missed.
Distribution operations benefit most from tracking Inventory Carrying Costs alongside real-time stock levels. Modernizing operations through these insights helps eliminate the expensive cycle of stockouts and overstocking. When warehouse managers have visibility into lead times and consumption rates, they can optimize reorder points to keep capital fluid rather than tied up in aging pallets. This visibility ensures that the fulfillment team is working with accurate data, reducing the manual effort required to reconcile physical counts with digital records.
Distributors can further refine their strategy by applying the Pareto Principle to their sales data. By using analytics to isolate the top 20% of customers that generate 80% of total profit, leadership can allocate account management resources more effectively. This data-driven approach ensures that high-value relationships receive the priority they deserve, while lower-margin accounts are managed through more automated, cost-effective channels. Integrating these sector-specific views is a critical phase of the digital transformation lifecycle. It transforms the ERP from a system of record into an active management tool. If your current system fails to provide this level of granular detail, contact our team to discuss how to configure dashboards that reflect the unique pressures of your supply chain.
Building Your Dashboard: Built-in ERP Tools vs. External BI Platforms

Deciding where to build your dashboard is a critical fork in the digital transformation lifecycle. For many small businesses, the native reporting capabilities within platforms like Odoo, NetSuite, or SAP Business One are the most logical starting point. These built-in tools offer the advantage of simplicity and cost; because the data already lives in the system, there is no need for complex API integrations or additional monthly subscriptions. If your primary goal is to track daily warehouse throughput or monitor cash flow within a single environment, a native tool provides real-time accuracy without the overhead of a separate data warehouse.
However, as your firm evolves by modernizing operations, you may reach the limits of what a standard ERP can visualize. This is where the conversation shifts toward ERP and BI for SMB strategies. Graduation to external Business Intelligence (BI) platforms like Power BI or Tableau becomes necessary when you need to blend data from multiple disparate sources. If your leadership requires a single view that combines ERP financial data with marketing performance, e-commerce analytics, and legacy spreadsheet data, an external BI tool is the superior choice.
These platforms handle complex data modeling and advanced visualizations, such as geographic heat maps and multi-year trend overlays, that native ERP tools often struggle to render. The decision to move to an external BI platform should be driven by the need for cross-functional insight rather than just aesthetic preference. If your team spends hours manually exporting data into Excel to create a single report, you have likely outgrown your built-in tools. For assistance in evaluating which environment best supports your growth, contact our team to discuss a tailored implementation strategy.
How Many KPIs Should Be on a Single Dashboard?
Determining how many KPIs should be on a dashboard is a matter of cognitive science as much as management. To maintain clarity, we recommend a limit of 5 to 9 KPIs per screen. Exceeding this range typically leads to cognitive overload, where the most critical trends are buried under a sea of secondary metrics. The goal of effective ERP reporting and analytics is to provide immediate clarity, not to force a user to hunt for insights.
Instead of building a single, sprawling interface, your digital transformation lifecycle should include the development of role-specific views. An Executive Dashboard for the owner might highlight consolidated cash flow and net profit, while a Production Dashboard for a shop floor manager focuses exclusively on machine uptime and order throughput. This targeted approach prevents managers from getting lost in data that does not influence their daily decisions. By modernizing operations with these distinct layers of visibility, you ensure that every team member remains focused on the levers they can actually pull. If your current interface is cluttered, contact our team to streamline your views.
Turning Insights into Action: The Human Element of ERP Analytics

A dashboard serves as a diagnostic tool, but the actual repair happens through human intervention. Once a system for ERP reporting and analytics is live, leadership must establish a structured Monthly Data Review. This is not a passive viewing session; it is a strategic meeting where owners and managers evaluate performance against targets, identify bottlenecks, and set concrete goals for the following month. If a chart shows a decline in gross margin, the review should uncover the root cause, such as a vendor price hike or inefficient labor hours.
Successful implementation requires training staff to move beyond simply looking at the charts. They must be taught to interpret what the data implies for their specific roles. For example, a warehouse manager should understand how days sales of inventory affects the company’s cash position. ERP & Software Consulting bridges the gap between software capability and team performance through hands-on training sessions. By focusing on practical outcomes rather than just technical navigation, we ensure that modernizing operations results in a culture of accountability. This approach is a core part of the digital transformation lifecycle, emphasizing ongoing improvement cycles over one-time setups. If your team is struggling to translate digital insights into operational results, contact our team to develop a training plan that works.
Effective ERP reporting transforms raw data into a strategic roadmap for your small business. By focusing on clear metrics and intuitive visualizations, you can make informed decisions that drive growth. While building these dashboards is rewarding, navigating the technical setup often requires a specialized touch. If you want expert help optimizing your software environment, you can learn more about our consulting services. We are here to help you turn complex data into clear, actionable insights for your organization.